|
Base Statistics
|
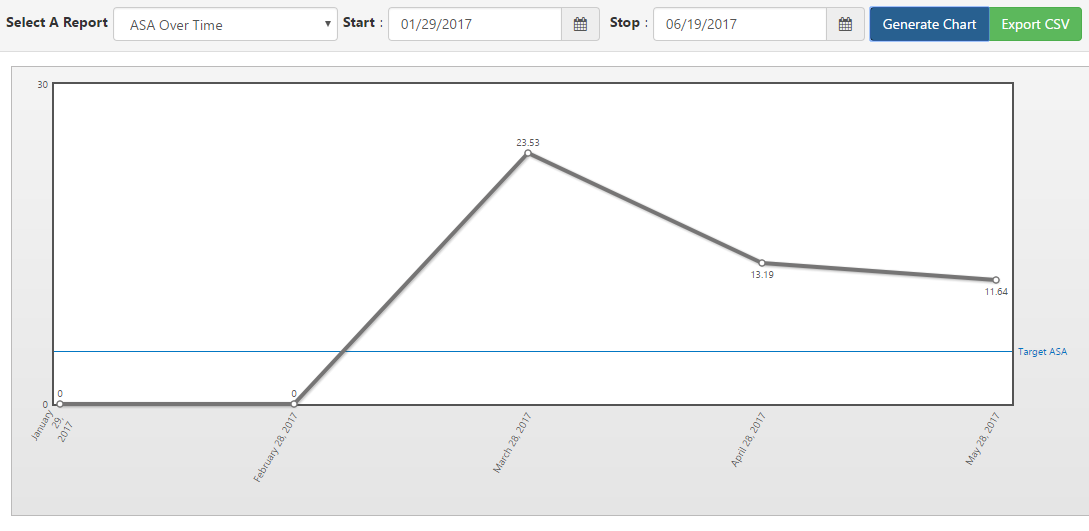
| ASA Over Time |
Average Speed to Answer for all agents in specified Queue. |
Line Graph |
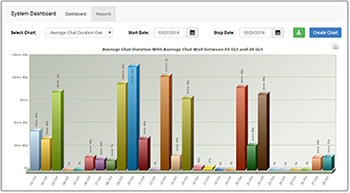
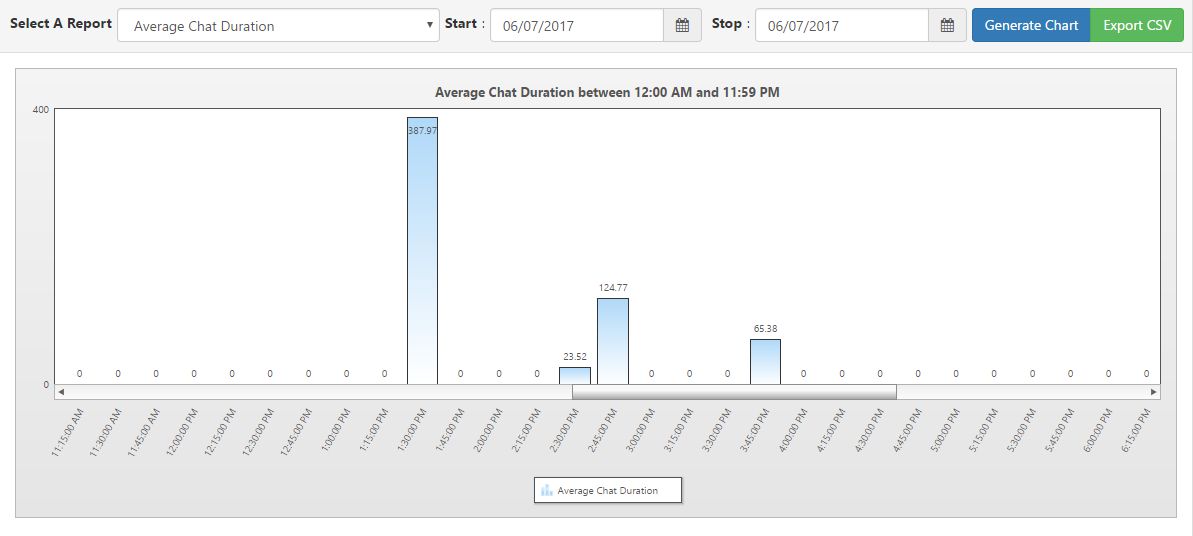
| Average Chat Duration |
Average chat duration for all agents in specified Queue. |
Bar Graph |
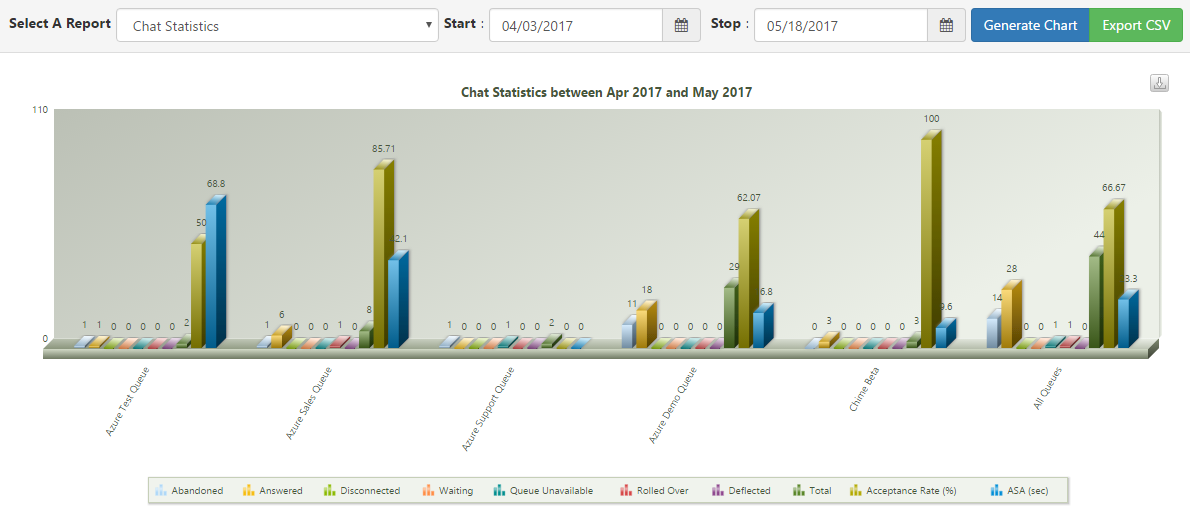
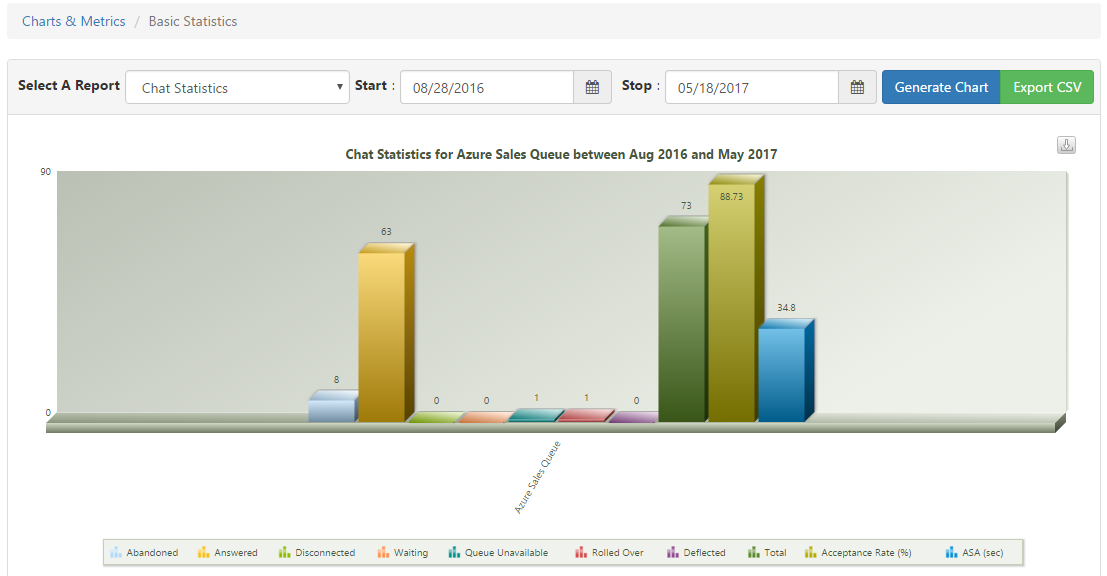
| Chat Statistics (2.6) |
This report is kind of a big roll-up of the results of all the chats in the queue over a time period. The columns in the report are:
Dropped – Number of chat sessions where the guest closed the chat before being routed to an agent.
Timed Out – Number of chat sessions where the guest timed out in the queue without being routed to any agent.
Answered – Number of chats where the guest was accepted and serviced by an agent.
Disconnected – Number of chats that encountered a network or application error which interrupted them before they could be completed.
Waiting – Number of chats that are currently waiting.
Queue Unavailable – Number of chats that entered the queue when the queue was not available, either because of its schedule or because there were no agents available to service chats
Rolled Over – If there is a roll-over queue configured, the number of chats that entered this queue, but were not serviced and instead rolled over to the other queue.
Deflected – With the Virtual Agent extension functionality, we have the ability to turn guests away from the queue before they enter the routing to an agent stage. This would be the count of chat sessions that were thus deflected by a Virtual Agent.
Total – Total number of chats.
Acceptance Rate (%) – Percentage of chats that were Answered, vs Dropped or Timed Out. Chats that were Disconnected, Waiting, Queue Unavailable, Rolled Over, or Deflected don’t factor into this percentage.
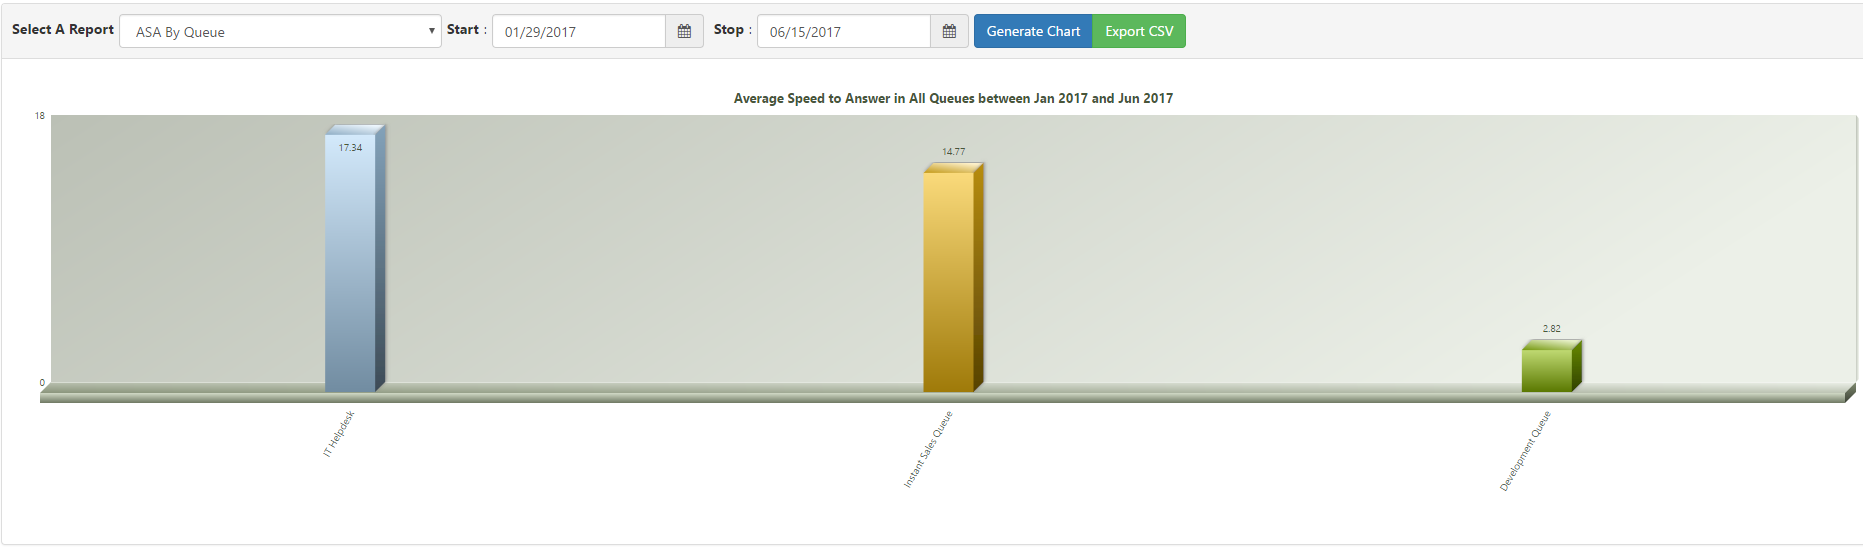
ASA (sec) – This is the Average-Speed-to-Answer or average wait time for the chats that were accepted by an agent.
|
Bar Graph |
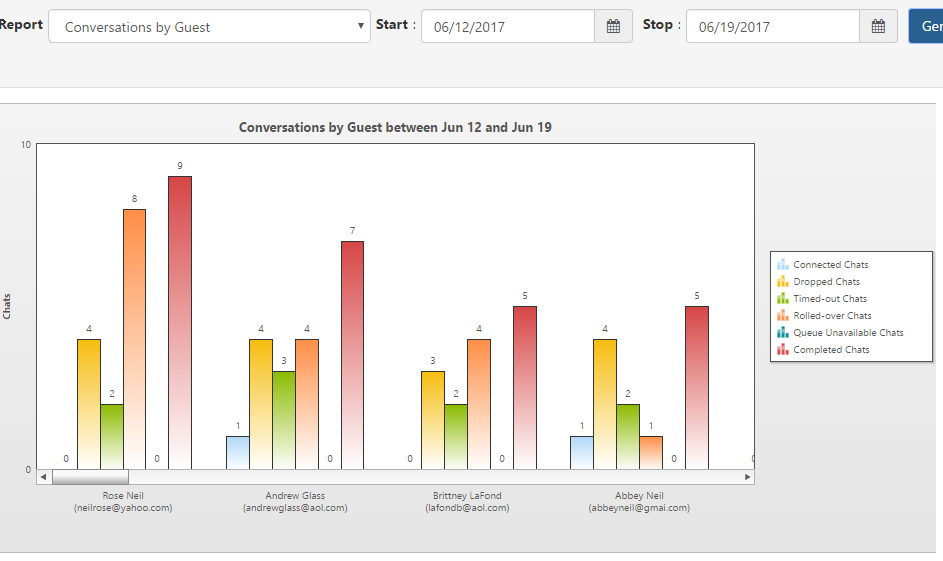
| Conversations by Guest |
Total number and type of conversations for each seeker in specified queue |
Bar Graph |
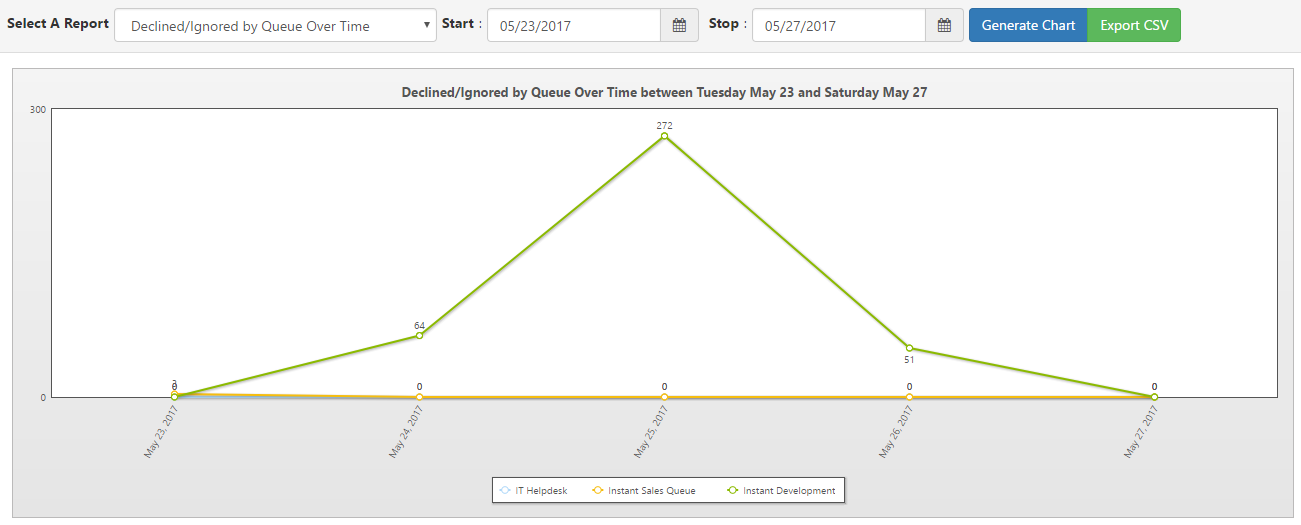
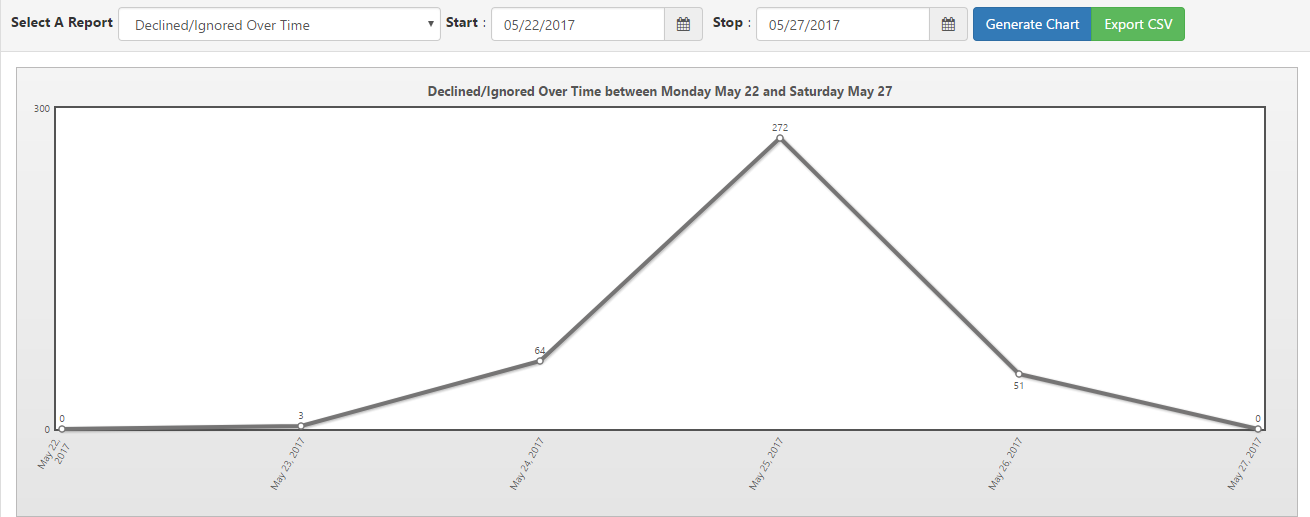
| Declined/Ignored Over Time |
This report shows the counts of chat sessions that were either Dropped or Timed Out before being connected with an agent, broken down by time intervals. Unlike the per-agent declined/ignored report, this counts entire chat sessions that were not routed, rather than the number of times that agents were prompted to accept and ignored/declined that prompt. For example, if a chat came in, and was offered and declined three times by agents, and then timed out, this report would count that as one declined/ignored chat, while the per-agent report would count the three agent declines. |
Line Graph |
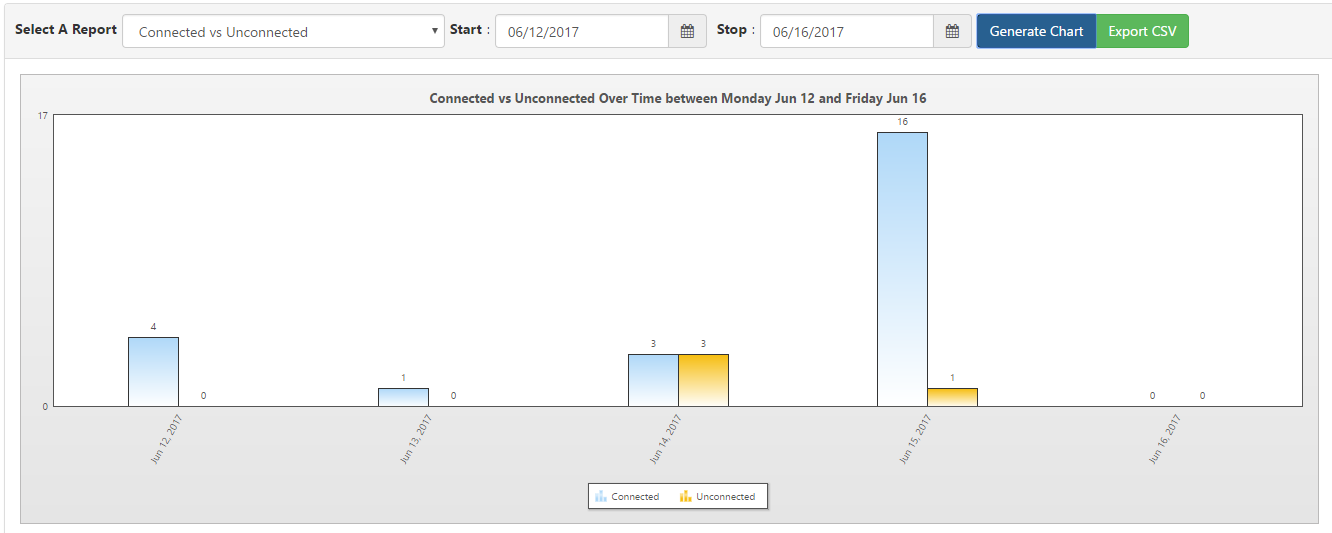
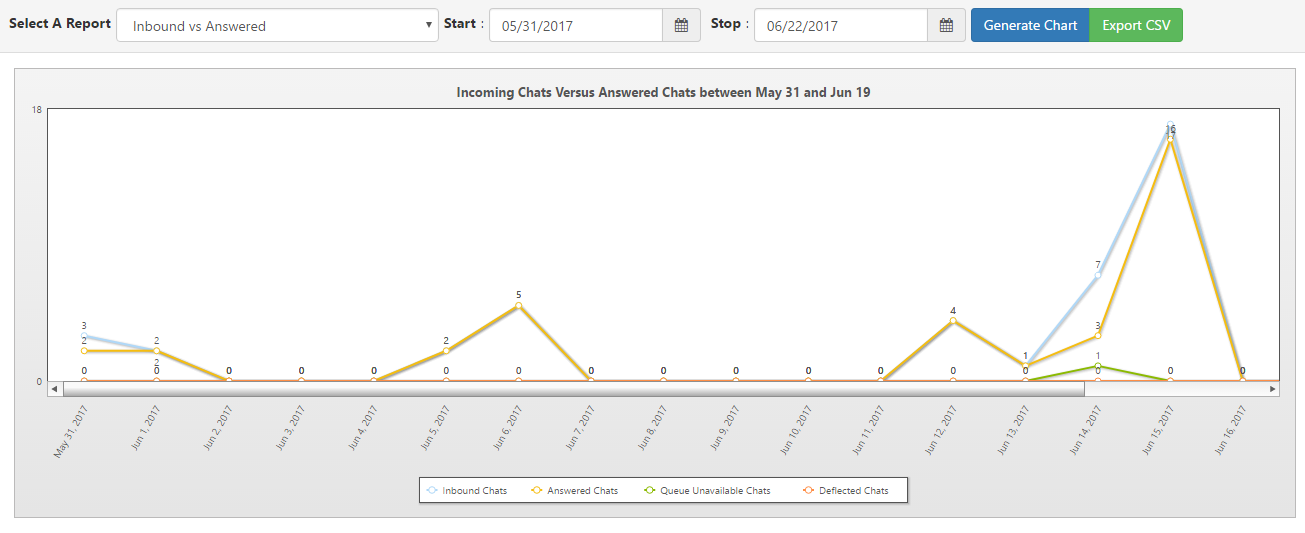
| Inbound vs Answered |
This report shows the number of total chats (Inbound Chats) vs the number of chats that were accepted by agents over time. It will also show the number of chats that came in while the queue was not available, either because of schedule or lack of available agents as Queue Unavailable Chats, and number of chats that came in but were deflected by a Virtual Agent before entering routing as Deflected Chats. |
Line Graph |
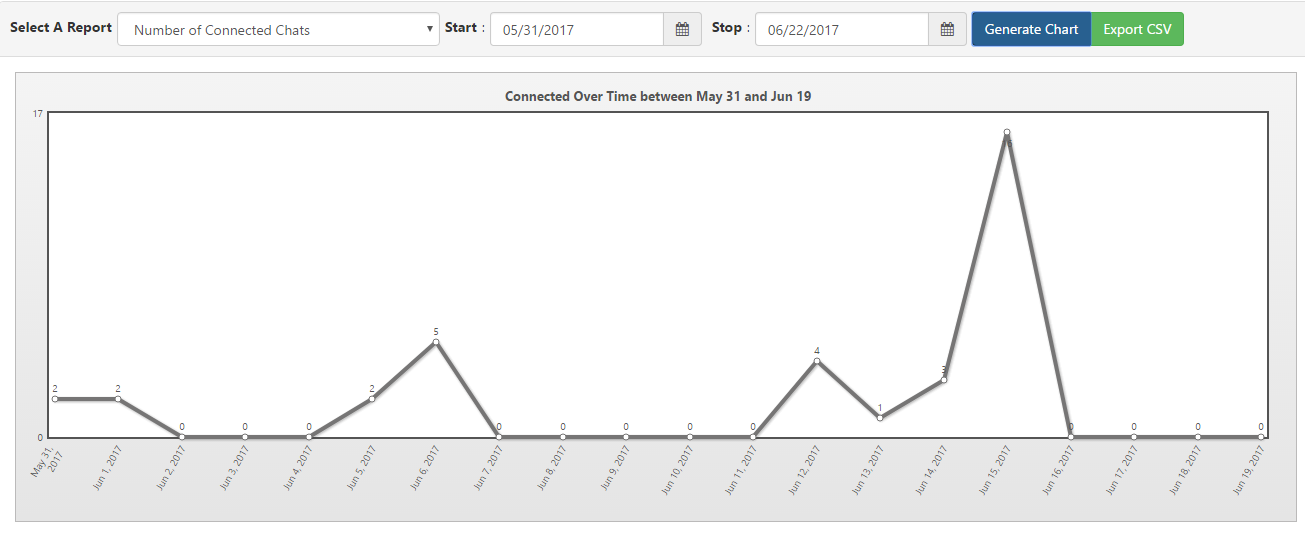
| Number of Connected Chats |
Total number of connected chats in specified queue |
Line Graph |
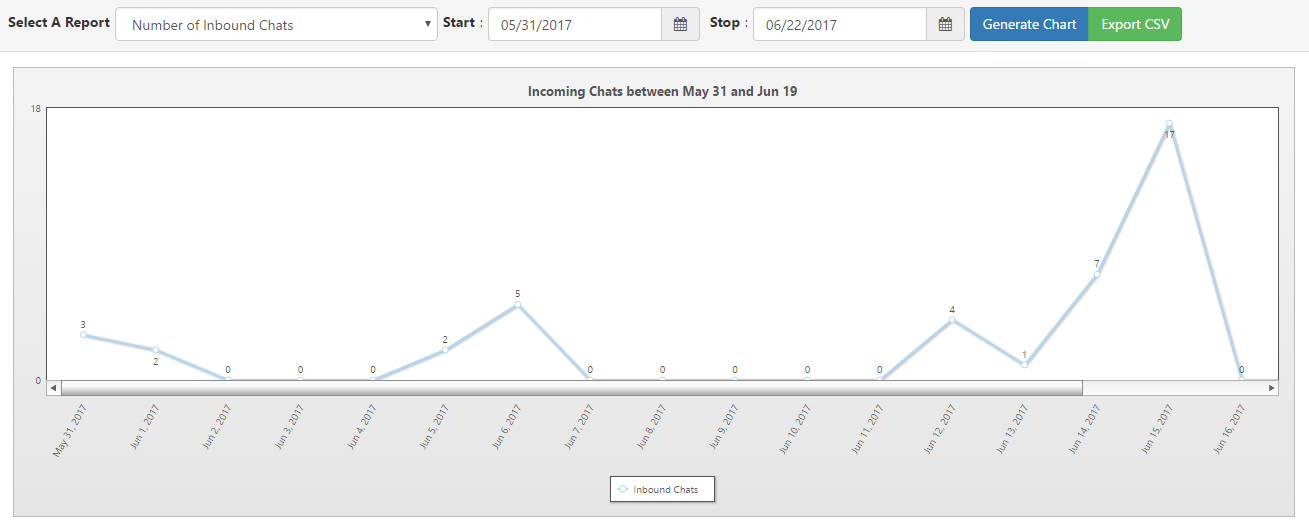
| Number of Inbound Chats |
Total number of inbound chats in specified queue |
Line Graph |
| Queue Availability (2.6) |
Shows when exactly a queue was online and offline for one day |
Timeline |
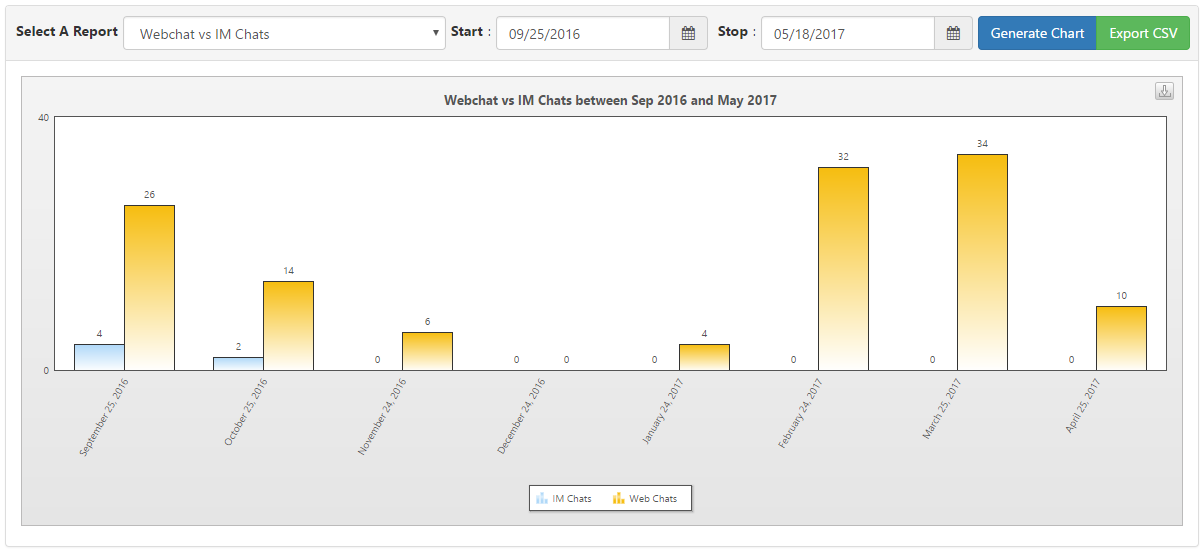
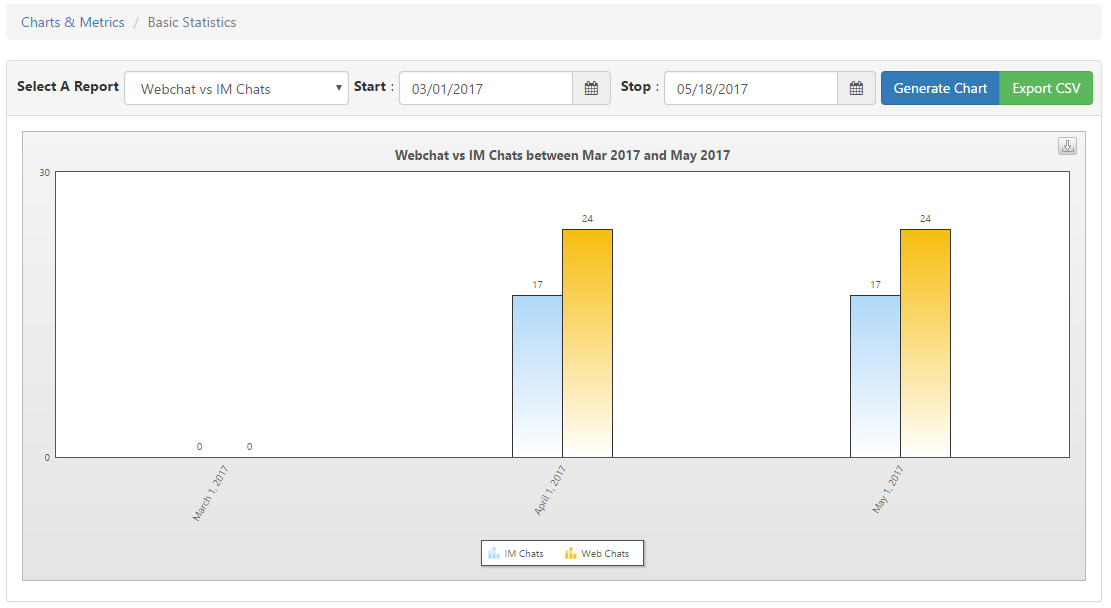
| Webchat vs. IM Chats (2.6) |
Shows how many chats have come through a web portal vs. a Teams client |
Bar Graph |
|
Agent Efficiency and Load
|
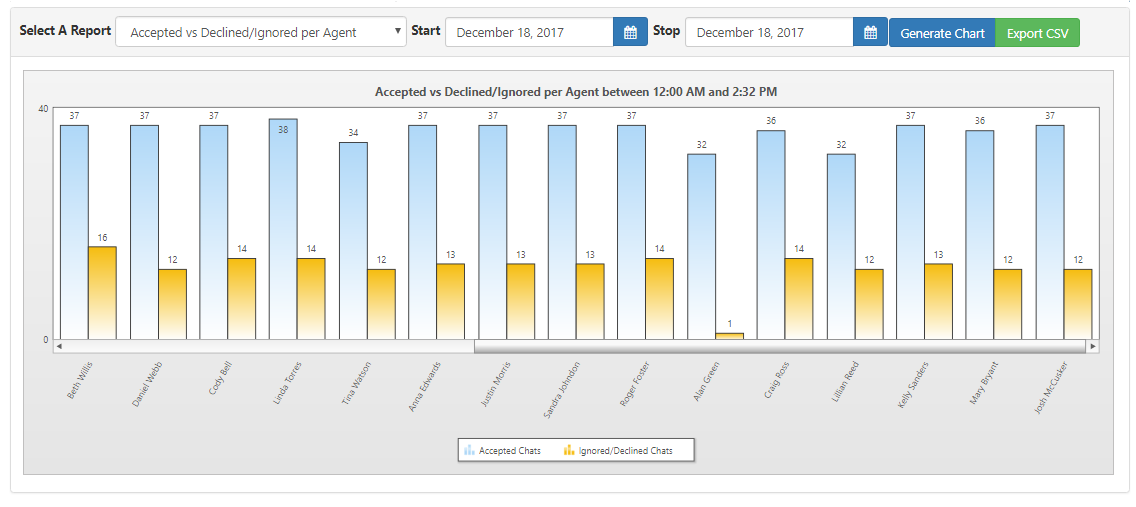
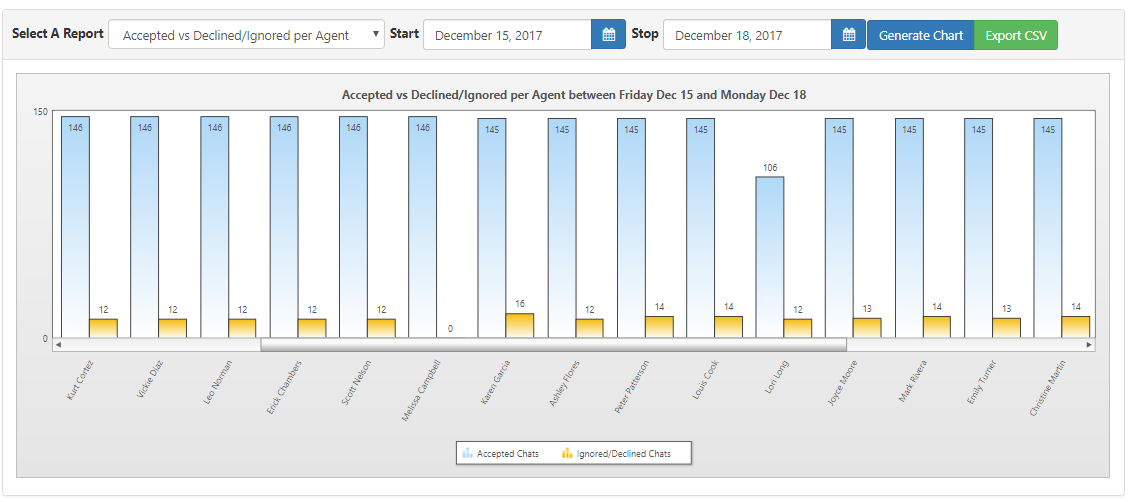
| Accepted vs Declined/Ignored per Agent (2.6) |
Shows the Accepted vs Declined/Ignored per Agent for a specific date |
Bar Graph |
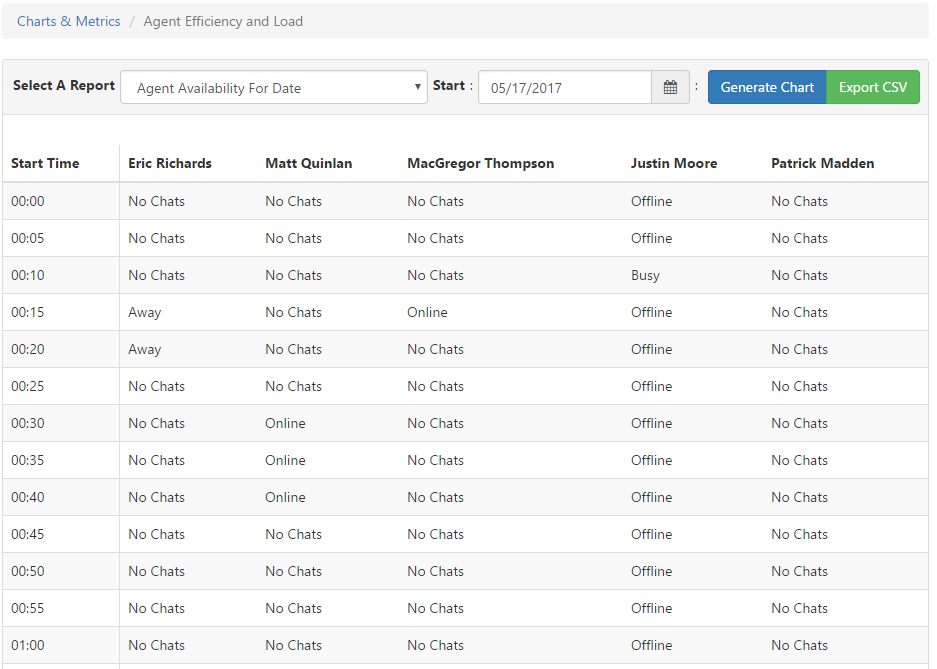
| Agent Availability for Date (2.6) |
Shows the Teams status for an agent through an entire day |
Table Chart |
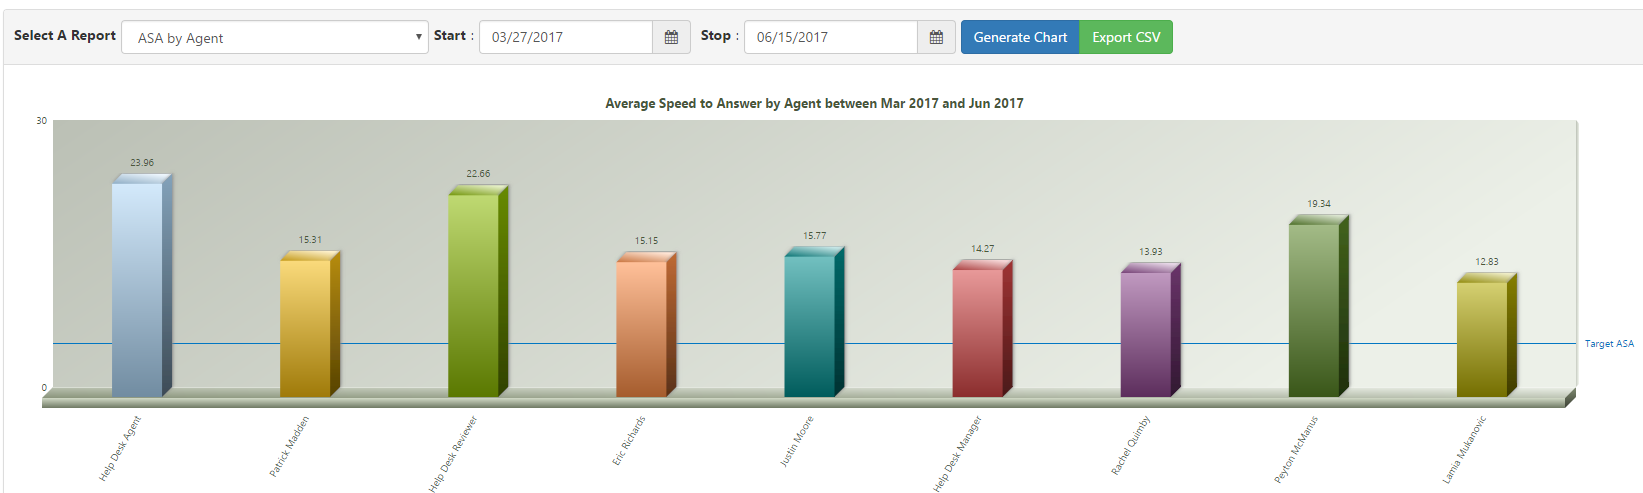
| ASA by Agent |
Average Speed to Answer for each agent in specified queue |
Bar Graph |
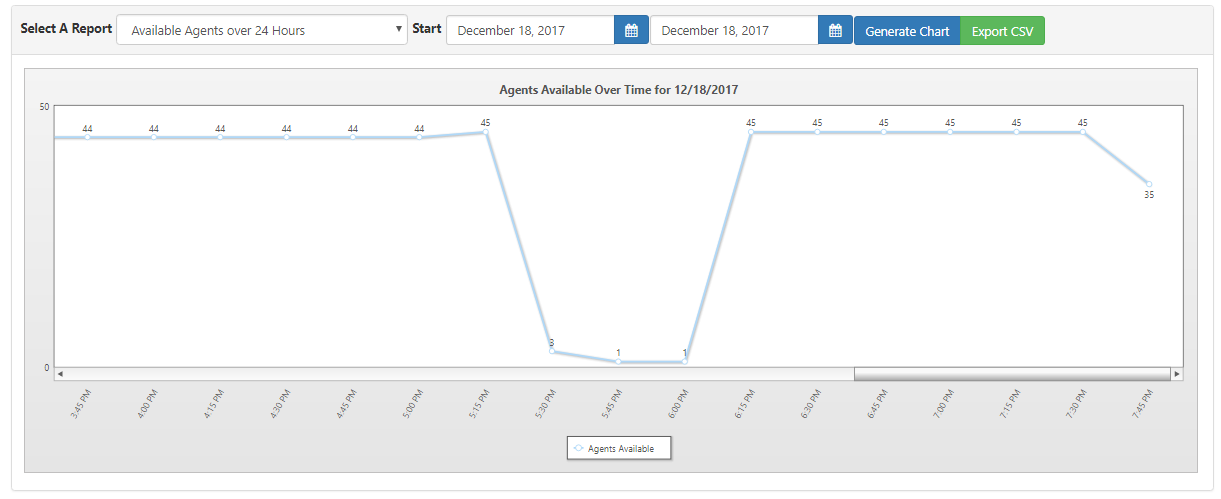
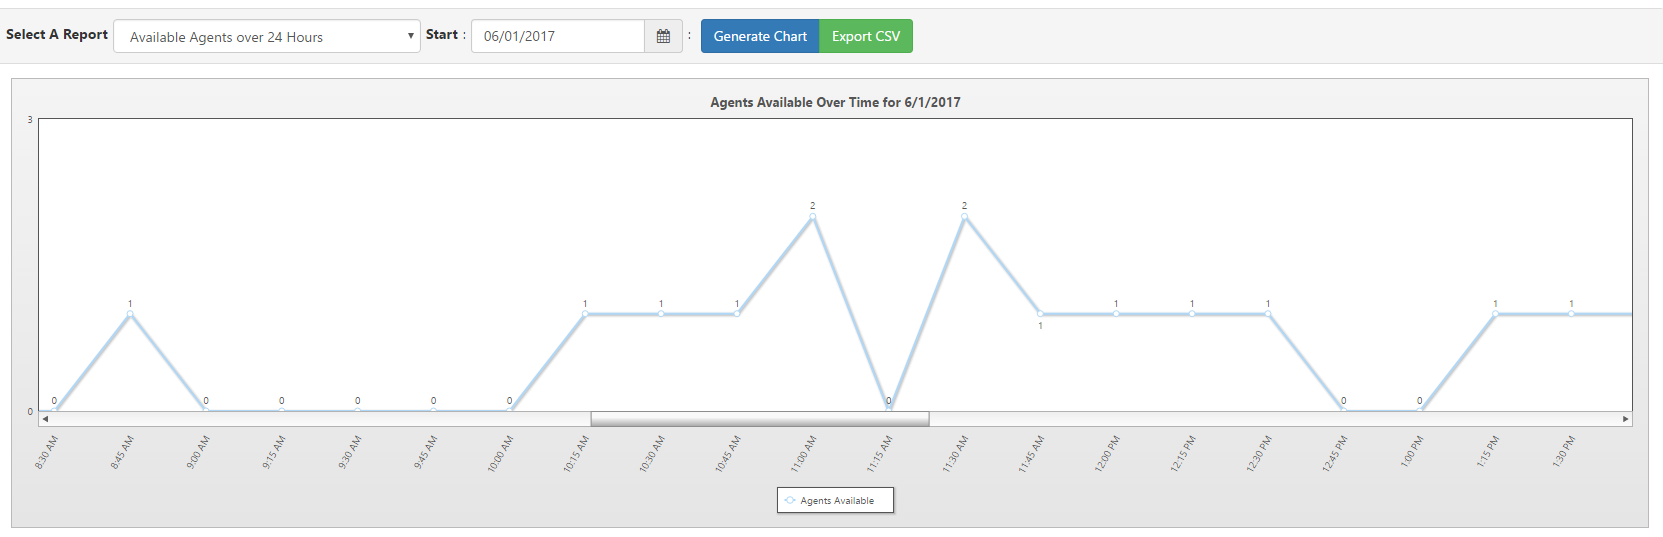
| Available Agents over 24 Hours |
Number of agents available in a period of one day in specified queue |
Line Graph |
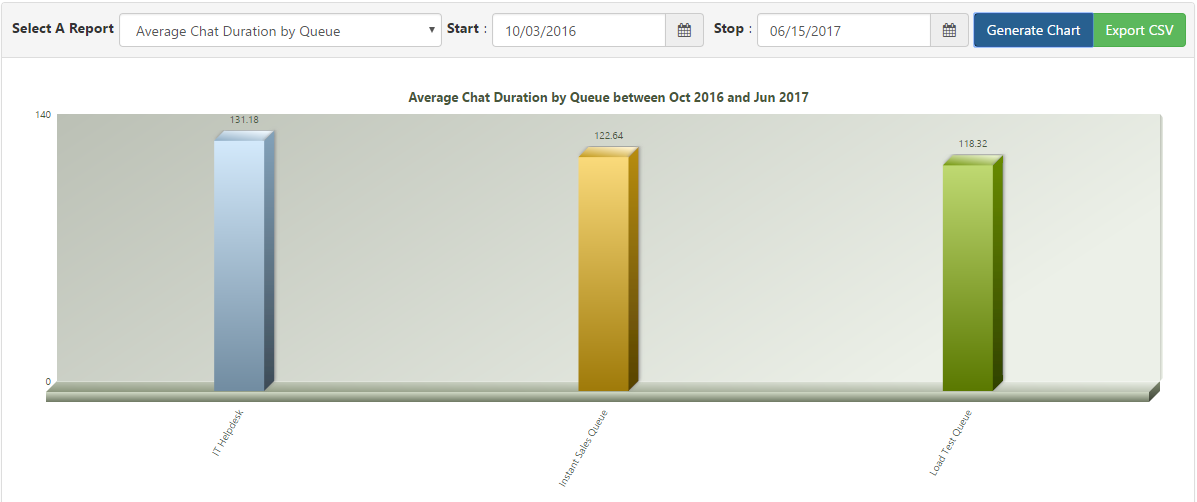
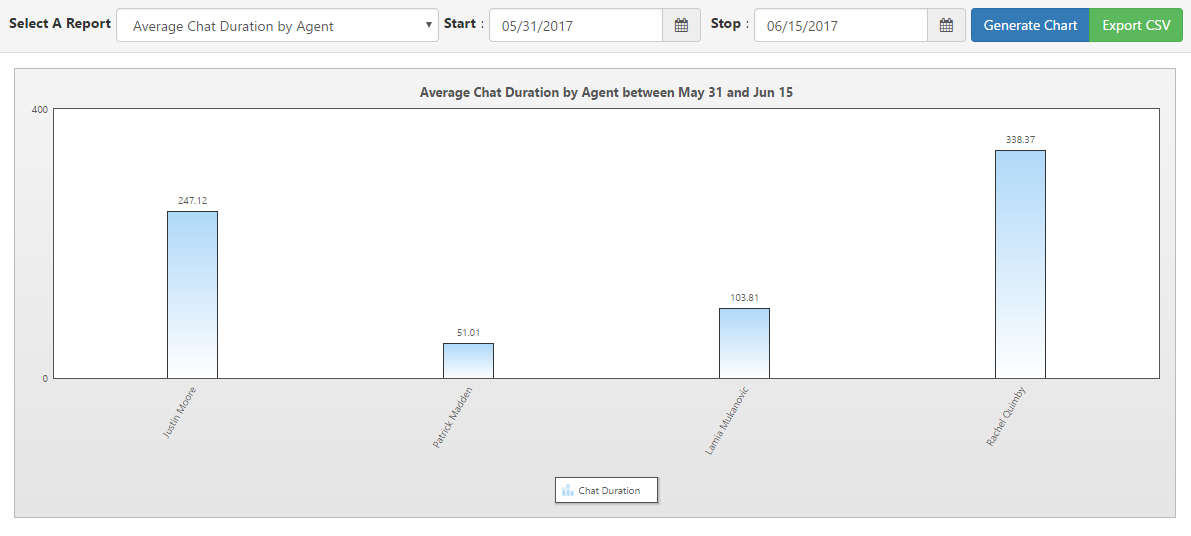
| Avg. Chat Duration by Agent |
Average chat duration for each agent in specified queue |
Bar Graph |
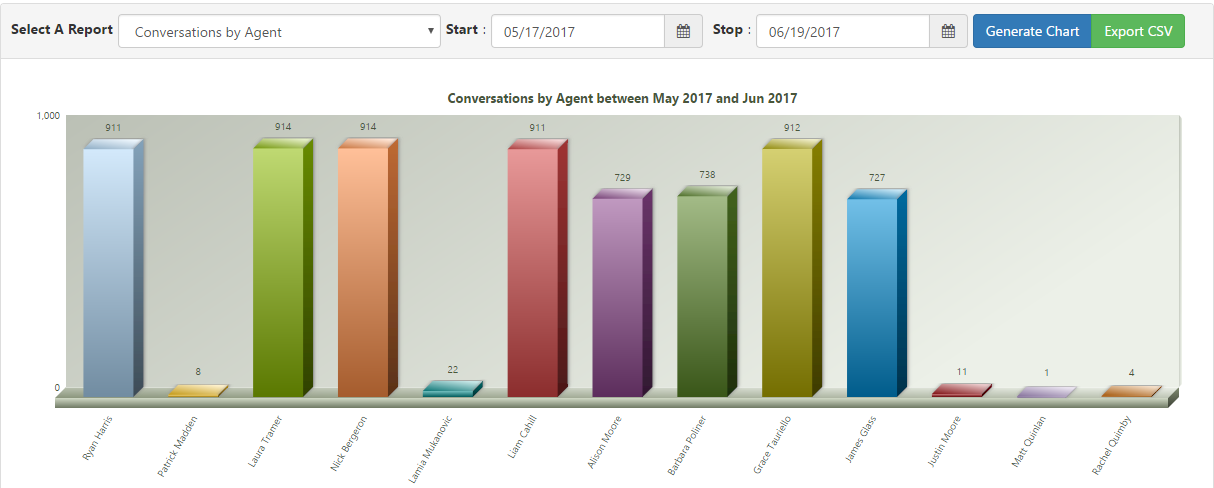
| Conversations by Agent |
Total number of conversations for each agent in specified queue |
Bar Graph |
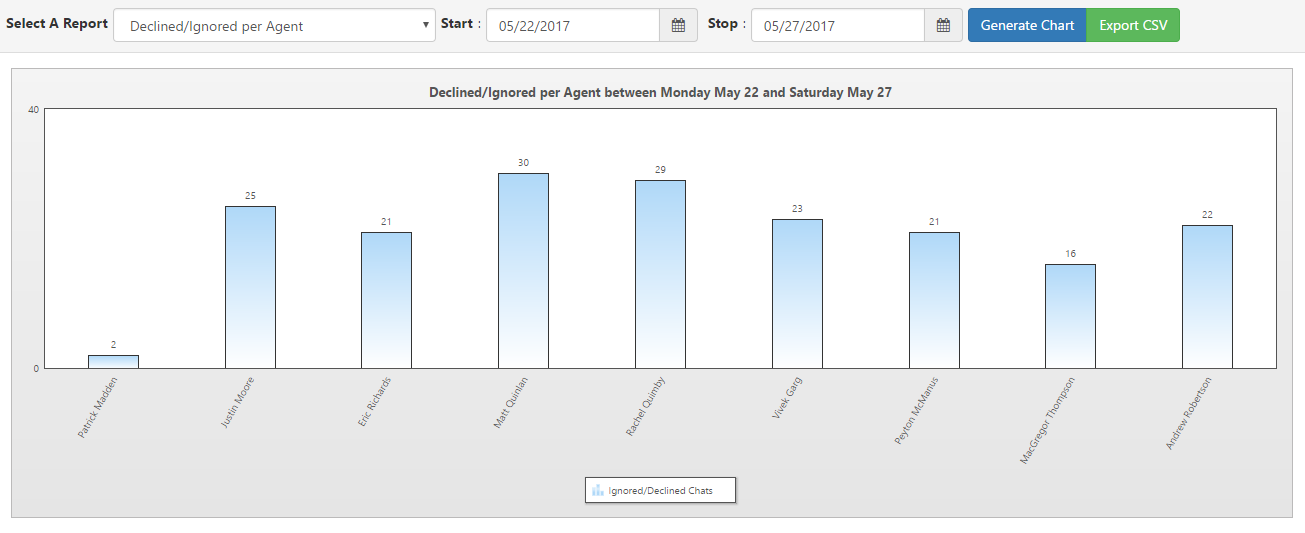
| Declined/Ignored per Agent |
Total number of ignored chats vs. declined chats for each agent |
Bar Graph |
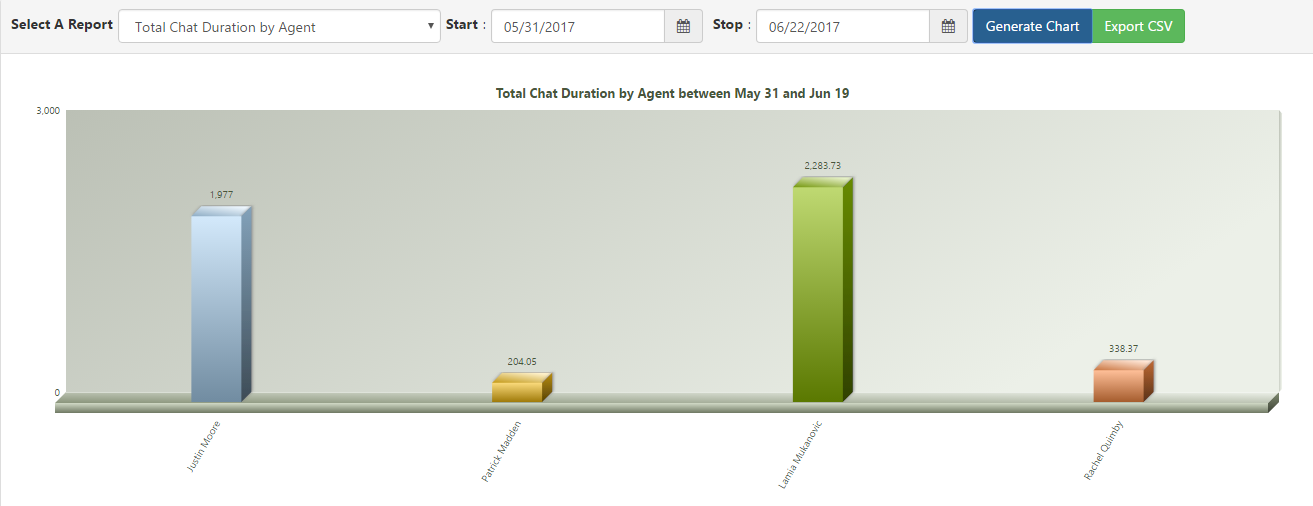
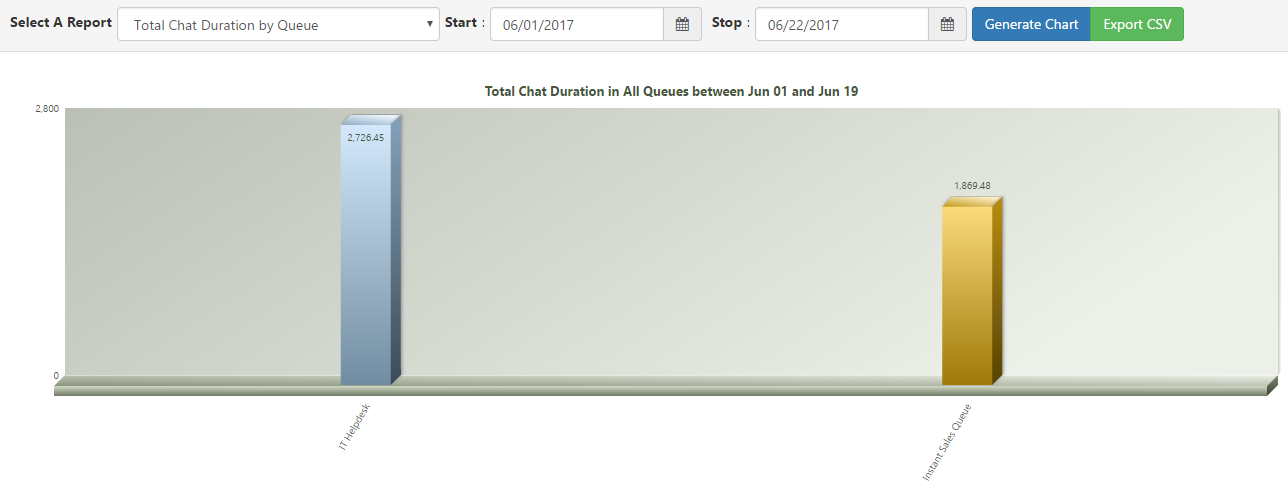
| Total Chat Duration by Agent |
Total chat duration for each agent in specified queue |
Bar Graph |
|
Performance Metrics
|
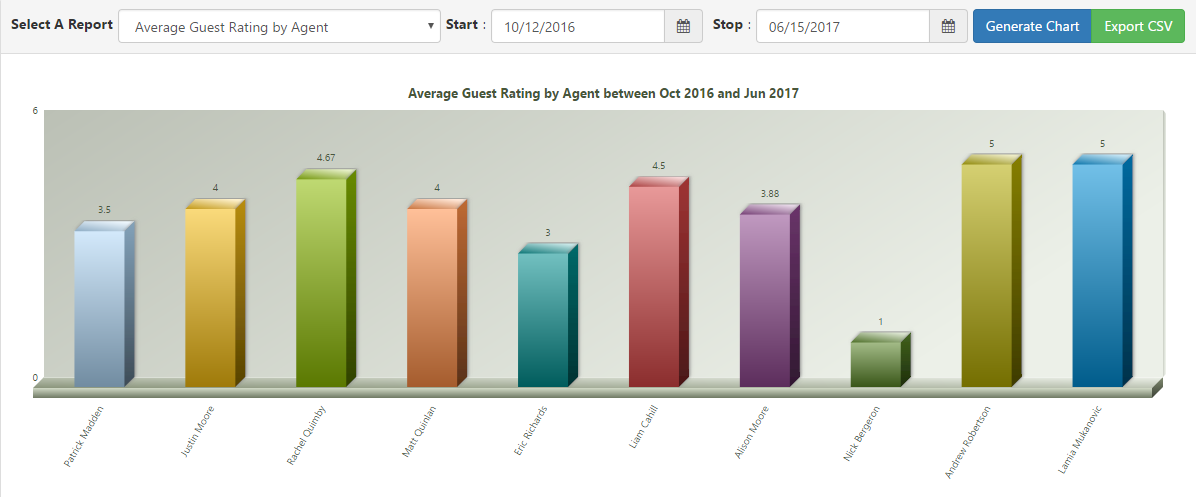
| Average Guest Rating by Agent |
Agents' average rating from seekers in specified queue |
Bar Graph |
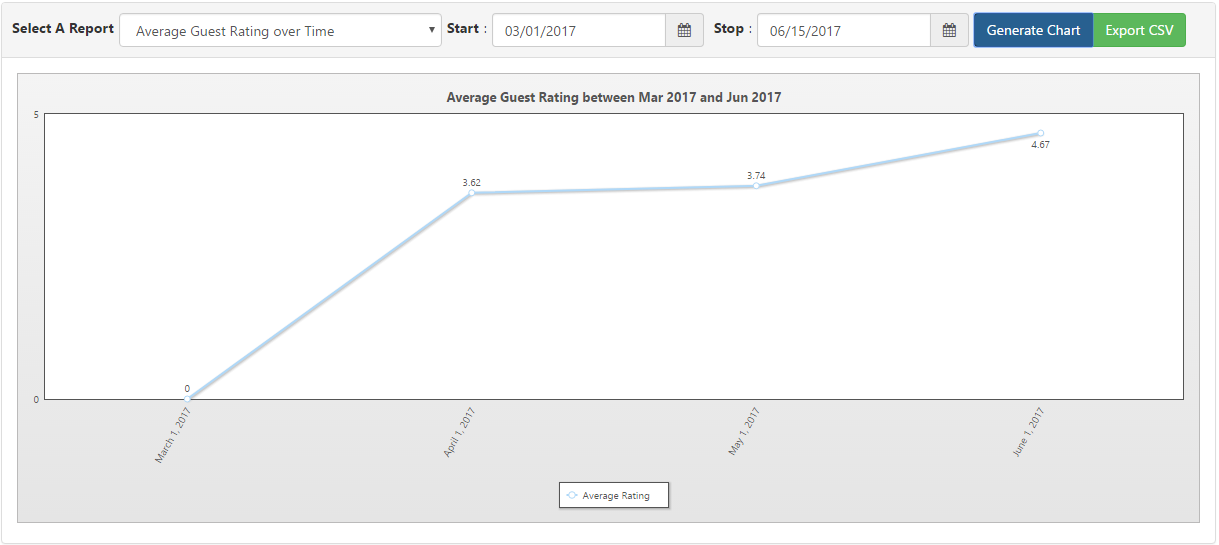
| Average Guest Rating over Time |
Average rating given to all agents over time in specified queue |
Line Graph |
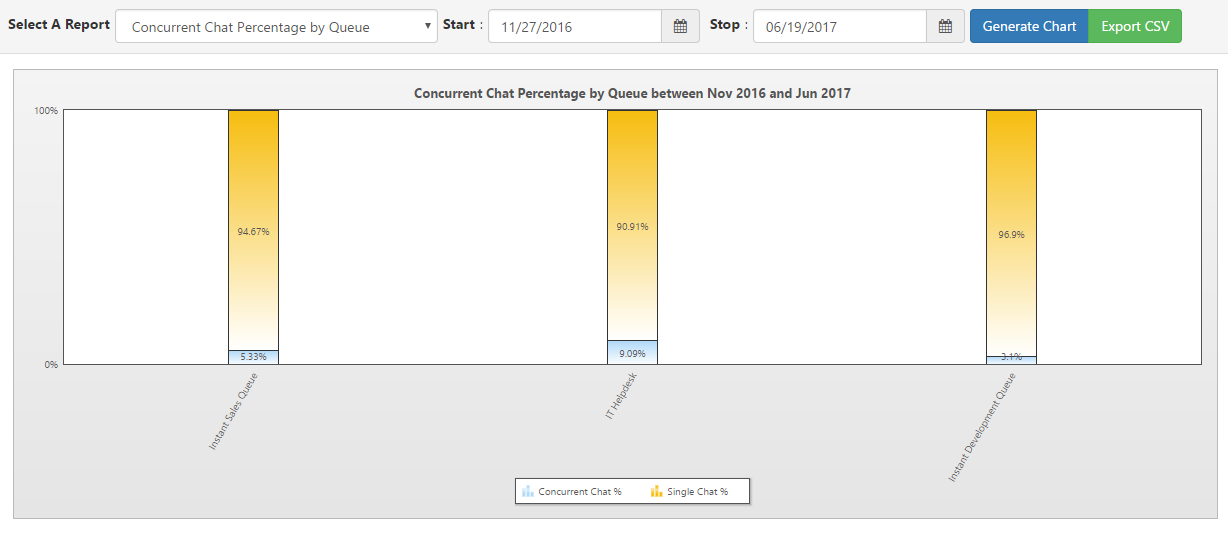
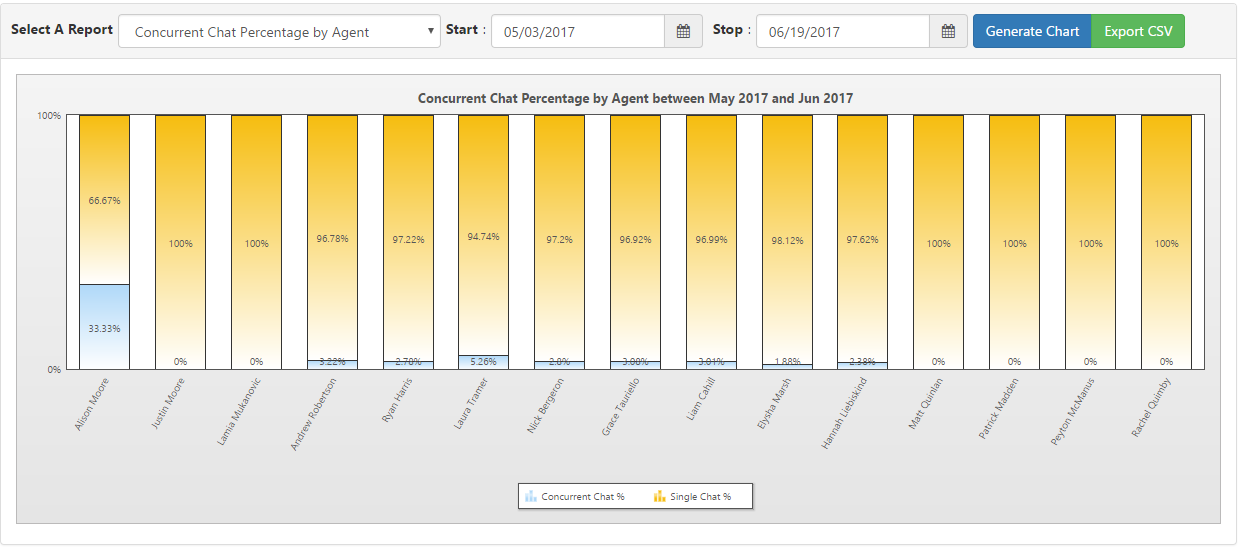
| Concurrent Chat Percentage by Agent |
Percentages of concurrent chats vs. single chats for each agent |
Bar Graph |
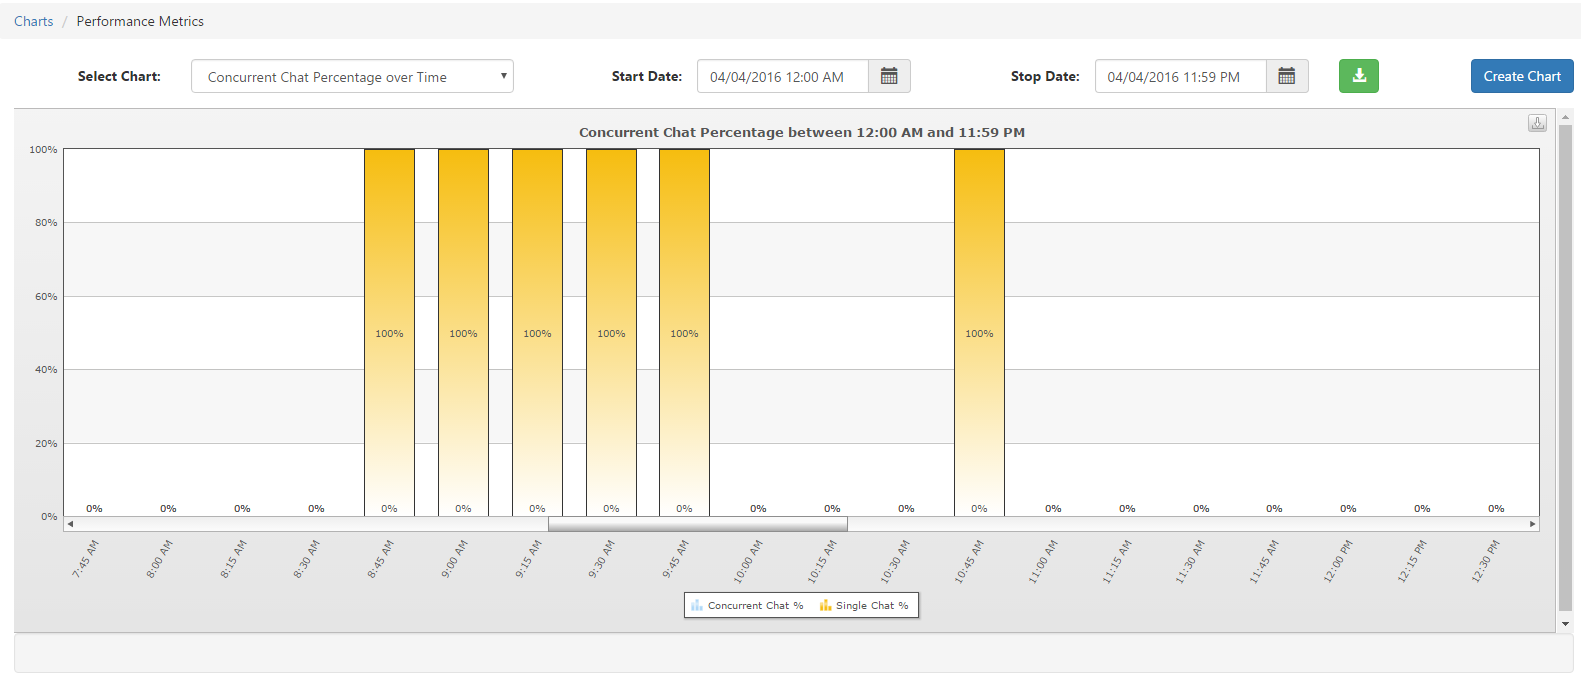
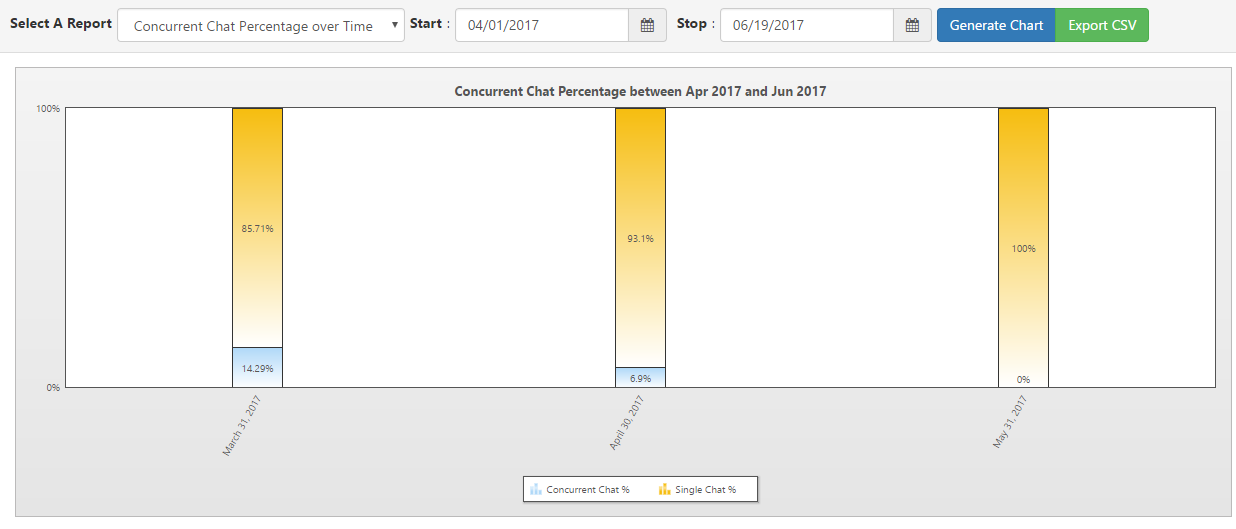
| Concurrent Chat Percentage over Time |
Percentages of concurrent chats vs. single chats of all agents for a queue over a period of one day |
Bar Graph |
|
Text Analytics
|
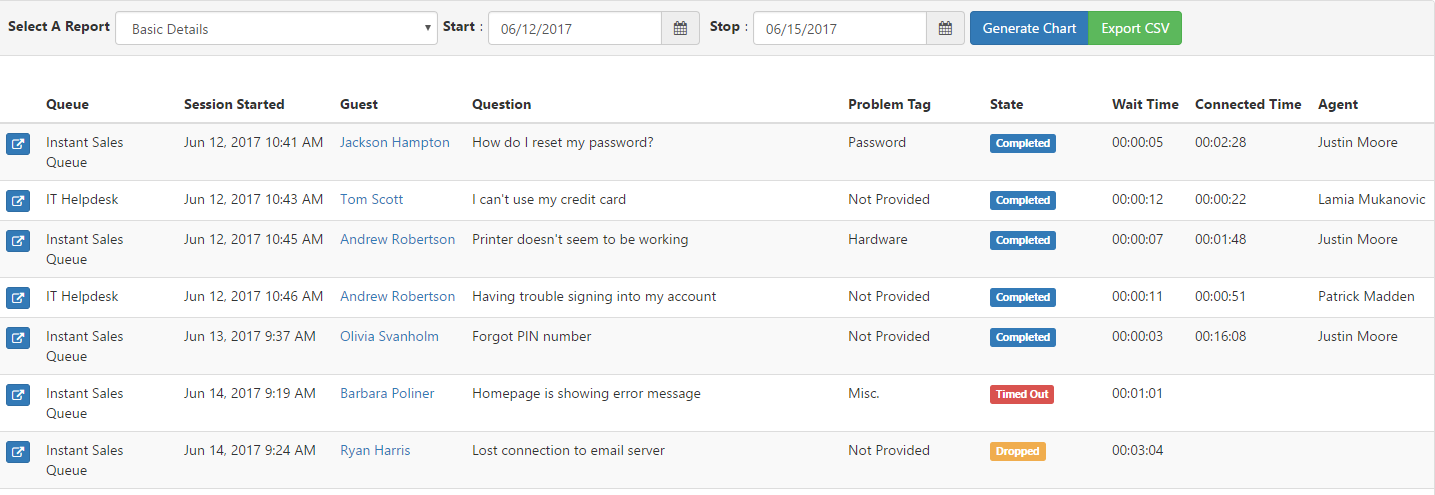
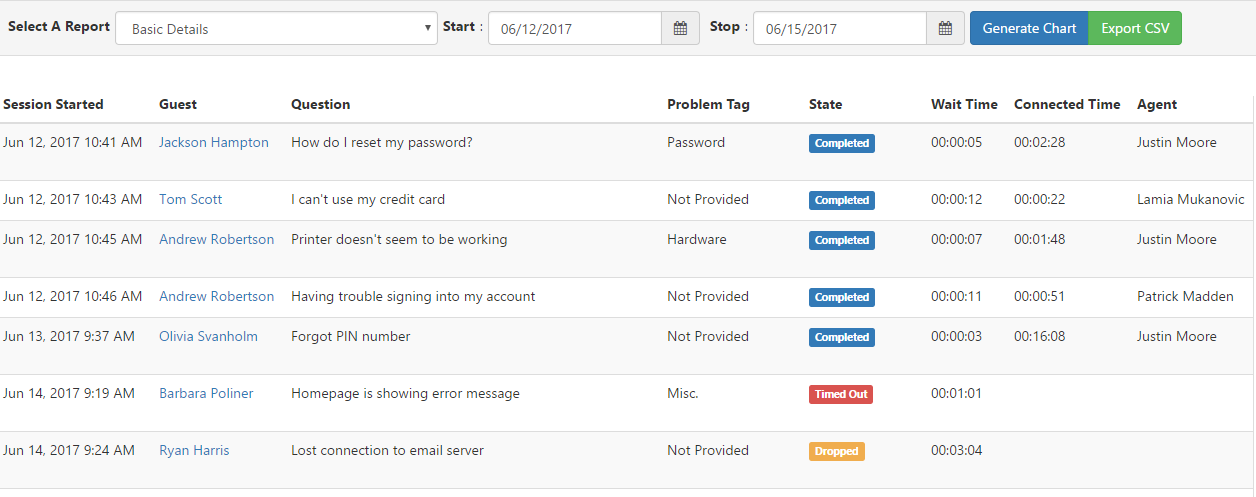
| Basic Details |
The Basic Details report is essentially the same information as would be shown in the queue dashboard Monitoring or Details panels, in that same tabular format, but with the option to choose a historical date range. |
Table Chart |
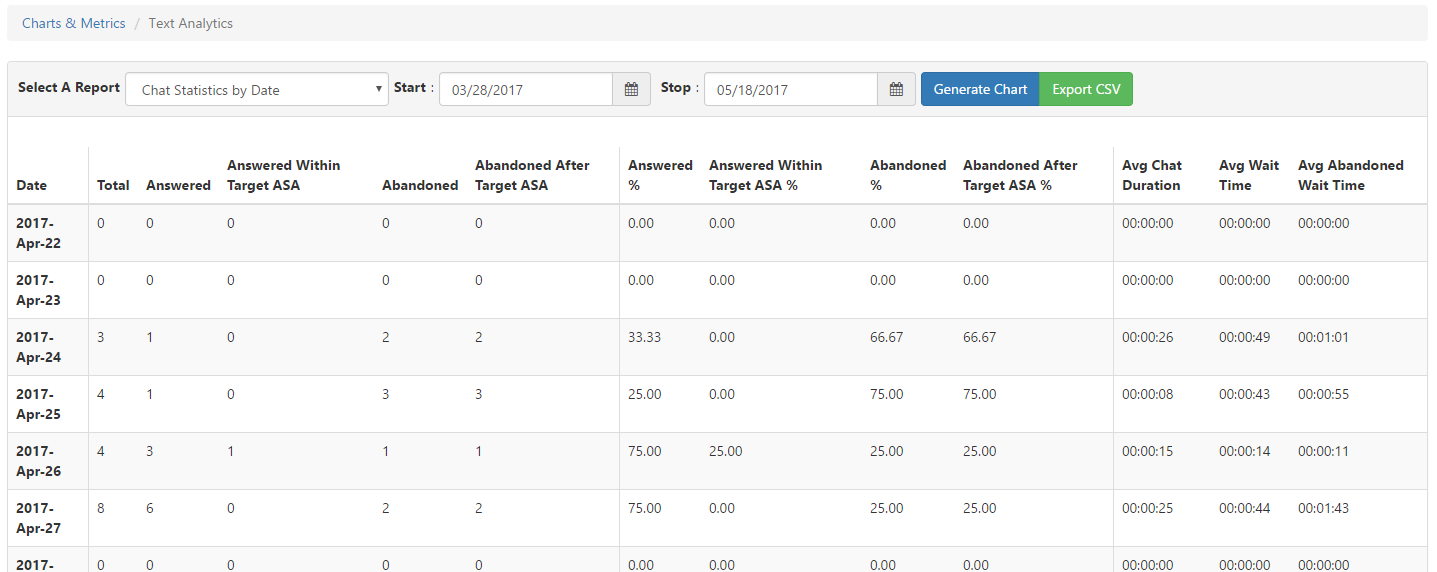
| Chat Statistics by Date (2.6) |
Shows statistics over a period of time, such as total chats, answered %, average wait time, etc. |
Table Chart |
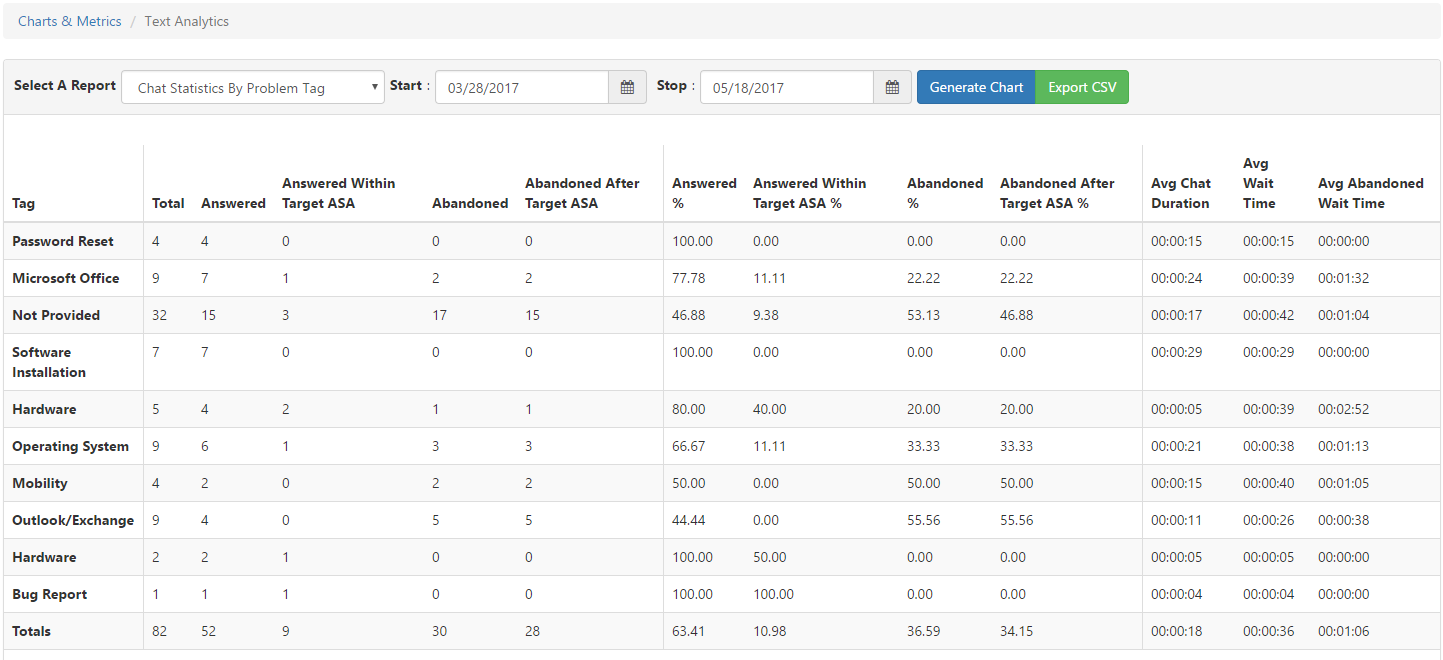
| Chat Statistics by Problem Tag (2.6) |
Shows statistics of chats with a certain problem tag, such as total chats, answered %, average wait time, etc. |
Table Chart |
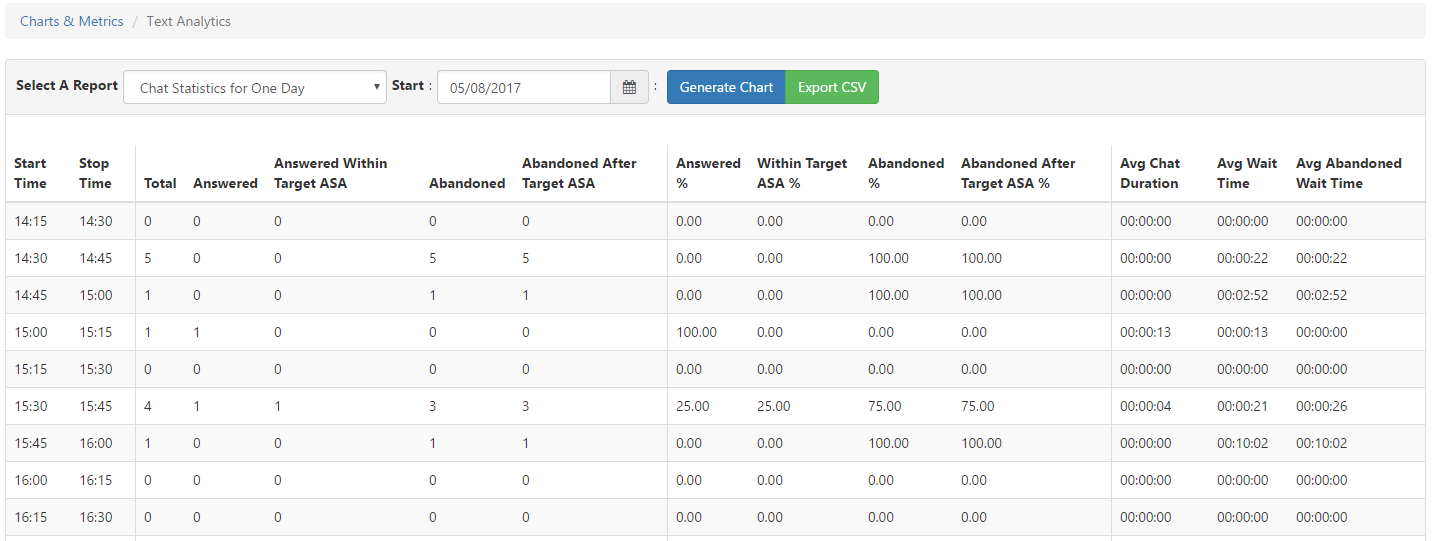
| Chat Statistics for One Day (2.6) |
Shows one day of statistics of chats in a queue, such as total chats, answered %, average wait time, etc. |
Table Chart |
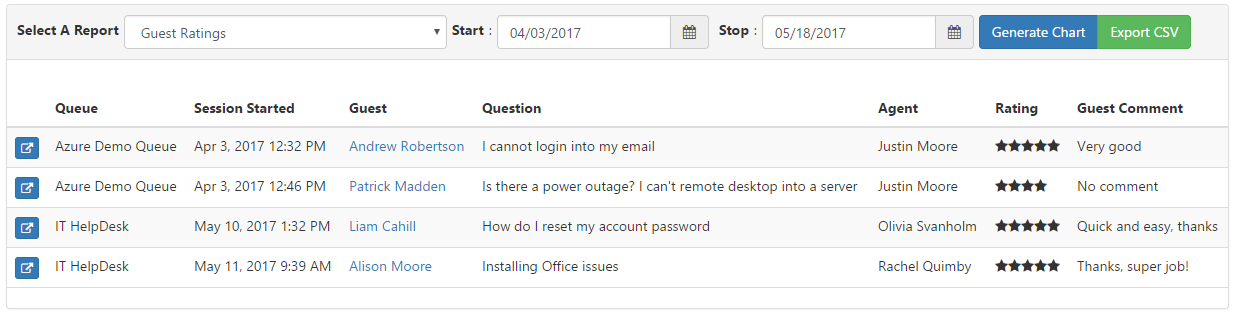
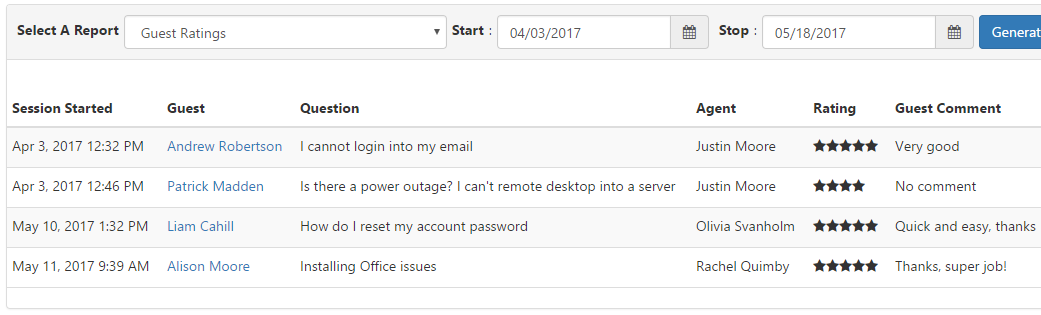
| Guest Ratings |
Displays seeker ratings and comments from all conversations |
Table Chart |
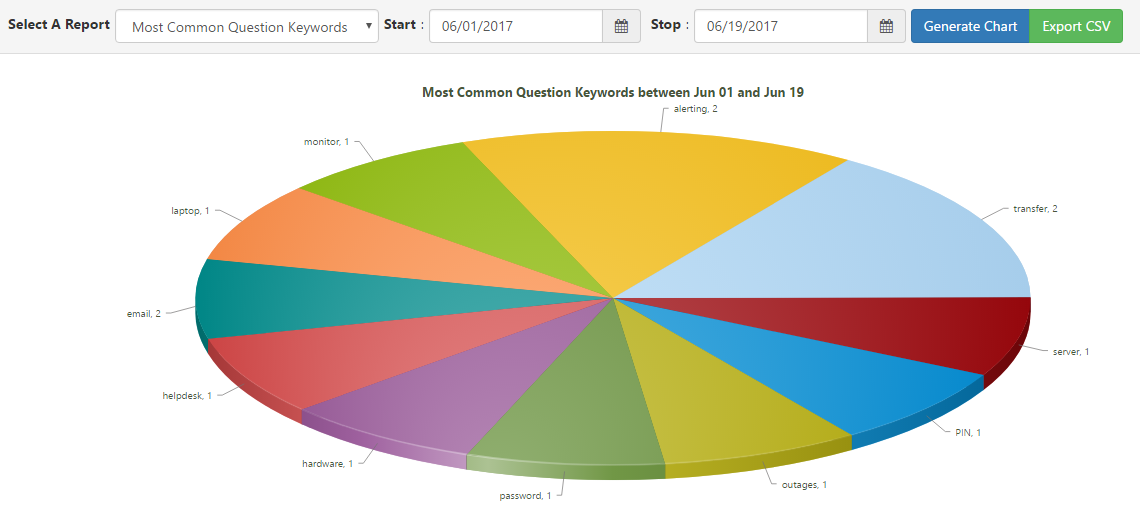
| Most Common Question Keywords |
Displays the most common question keywords from all conversations |
Pie Chart |
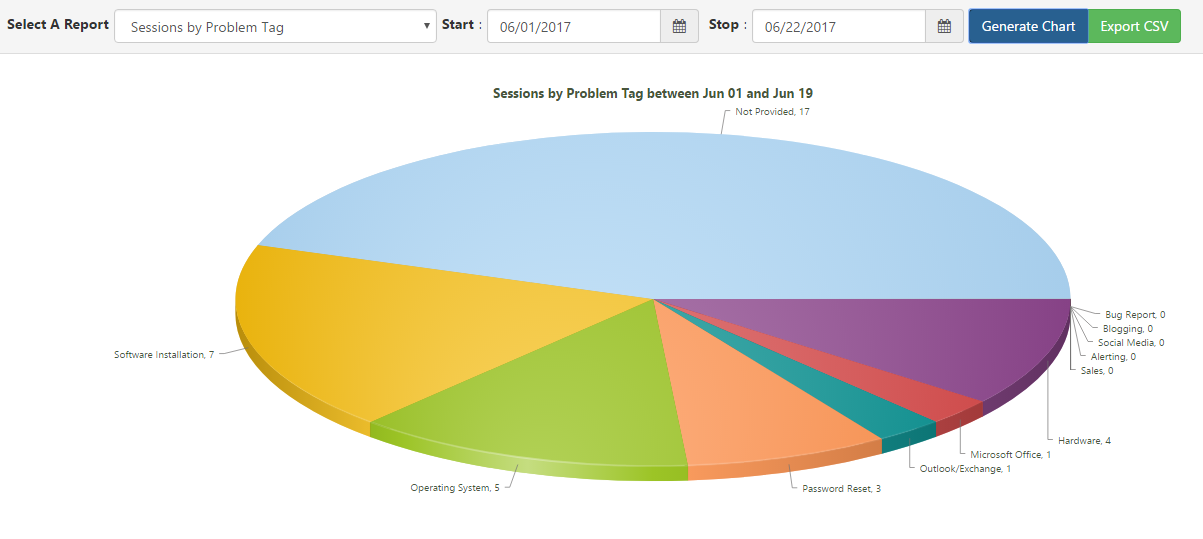
| Sessions by Problem Tag |
Shows a pie chart of all the relative problem tags from all the conversations |
Pie Chart |
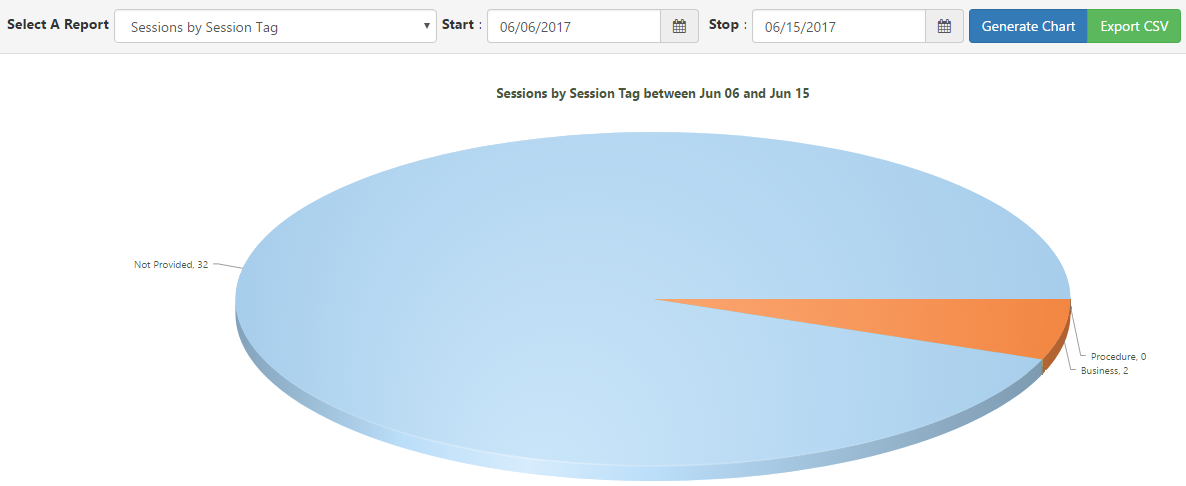
| Sessions by Session Tag |
Shows a pie chart of all the relative session tags from all the conversations |
Pie Chart |
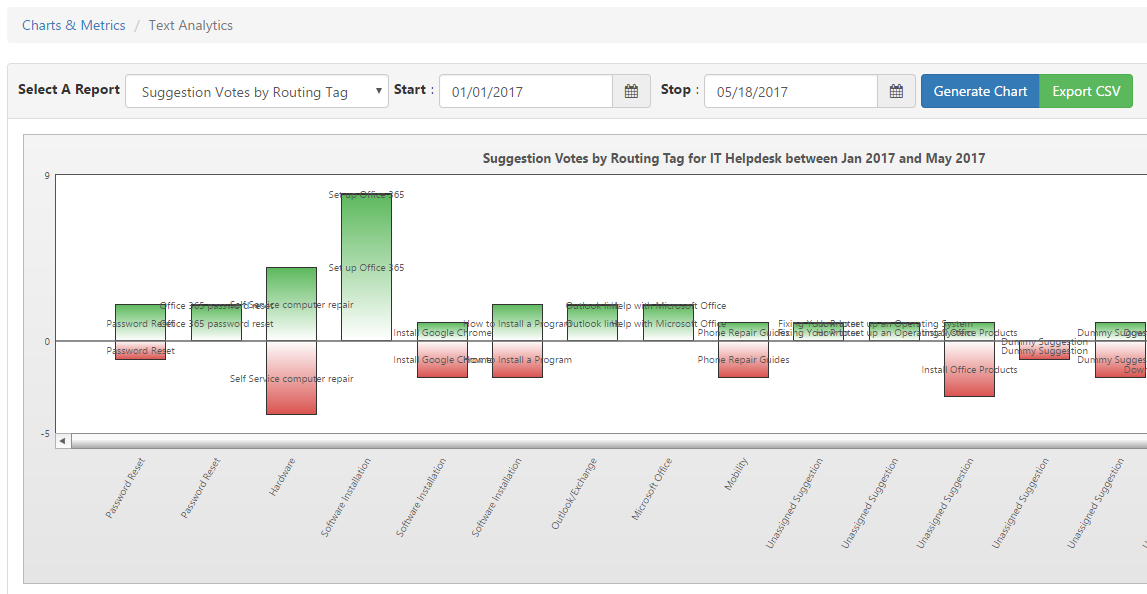
| Suggestion Votes by Routing Tag (2.6) |
Number of upvotes and downvotes for each suggestion |
Bar Graph |
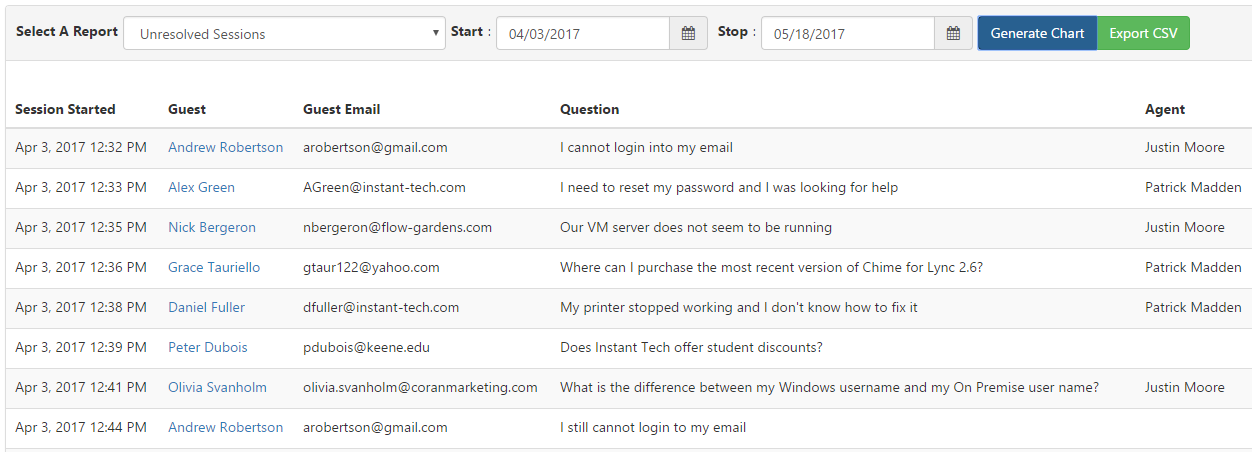
| Unresolved Sessions |
Displays all conversations that have been marked as "Unresolved" |
Table Chart |